Aggregate Amazon Sales & Profit Data
Collect sales, profit, and return statistics across multiple Merch by Amazon accounts in one report. This tool consolidates data by day, week, month, and all-time — ideal for account managers and operations teams running Amazon account maintenance at scale.
How to Use the Sales Aggregation Tool
- Select the
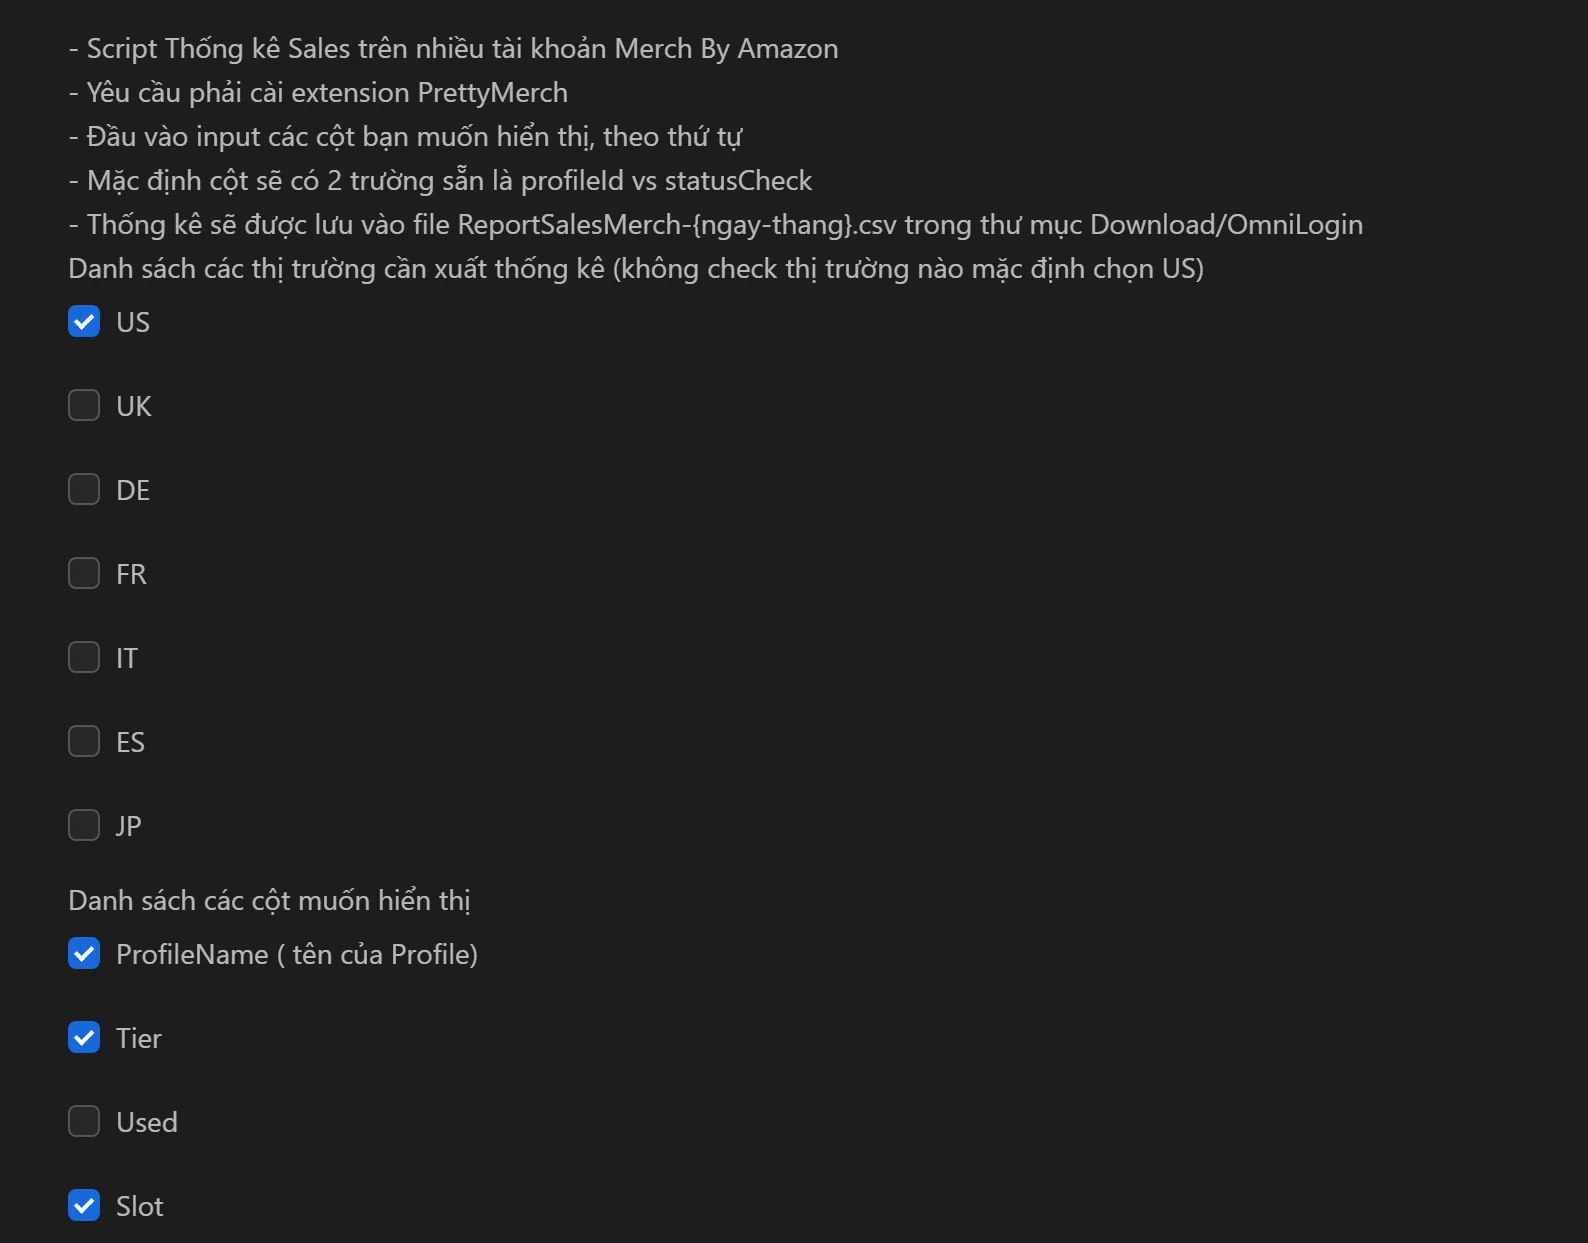
ProfileNames (accounts) to include in the report. - Choose your data columns (sales, royalties, returns, cancellations).
- Select the marketplace (US, UK, DE, FR, IT, ES, JP).
- Click Run to generate the report.
- Export results as
ReportSalesMerch-{date-month}.csvfor Excel or Google Sheets.
Available Data Columns
- Account info: ProfileName, Tier (T10, T100, T500...), Used/Slot (designs used vs. available)
- Yesterday: Sales, Royalties, Returns, Cancellations
- Last 7 Days: Sales, Royalties, Returns, Cancellations
- This Month: Sales, Royalties, Returns, Cancellations
- Previous Month: Sales, Royalties, Returns
Key Features
- Multi-account consolidation — Aggregate data from all accounts into a single CSV file
- Marketplace filtering — Export reports for specific markets (US, UK, DE, FR, IT, ES, JP)
- Flexible column selection — Choose exactly which metrics appear in your report
- CSV export — Open in Excel or Google Sheets for charts and further analysis
Practical Use Cases
- Periodic reporting: Select client accounts, choose relevant time-range columns, export CSV, and build professional reports in minutes
- Market comparison: Run separate reports for US vs. DE to compare sales performance and decide where to focus
- Team performance: Export monthly royalties by ProfileName, group by team member, and calculate KPIs
- Problem detection: Check daily sales and returns to quickly spot accounts with unusual spikes in returns or sudden drops in revenue
Tip: Combine this tool with Merch by Amazon content generation to track how new designs perform across marketplaces.